 Log in

This one is from 1809, written by Napoleon’s nephew.

|
Just because I don't care doesn't mean I don't understand.
|


Watching discussions happening online, I see a frequent unfortunate tic I’ll call the Expert Asterisk. A beginner is asking for help, and experts are answering. Then in the spirit of completeness, an expert throws in a fact or detail far from the learner’s abilities or needs.
As an example, here was an interaction about git: a new learner was having
trouble getting properly oriented. They were asking how branches relate to
directories, and how to undo a change. They knew about git init but
didn’t know how it related to changing projects.
newb: so every time I change project I simply do ‘git init’ on them?
expert1: ‘git init’ is for creating a new project.
expert2: you change your working directory, typically, when you change project
So far so good, but then:
expert2: or you specify the git repo directory with the -C switch, but it’s more typing to do, so hardly anyone does that unless there’s a very good reason
What!? Why mention this while explicitly pointing out no one does it? The newb just barely understands how git works at all. Why introduce obscure command-line options that “hardly anyone” uses?
I call this an asterisk because it feels like an esoteric footnote that only experts, academics, or completionists would need to know.
The expert is trying to be helpful. They are presenting all the options in the optimistic hope that the newb will be able to pick and choose among them.
Worse, sometimes multiple experts each offer their own asterisks, and the poor newb is intrigued and distracted by each one. The new learner doesn’t have a way to sift out which details might be important to them. Their original question gets lost in the spreading tangents.
It’s hard to help new learners: we can’t know where their gaps are. What misconceptions need to be unwound? Often we have only a glimpse of their context. Experts can miss when they use words slightly wrong, taking them at face value instead of seeing the misunderstanding that leads down the wrong path.
Notice in the exchange above, “change project” could mean switching among existing projects or starting a new project. We’re not sure which they meant. An expert will cycle among a number of active projects, but beginners will work on one until it is done, then switch to a new project, never returning to the previous one. Perhaps “every time I change project I do ‘git init’” was right for their situation.
The -C comment didn’t derail the session, but the effort of that
comment could have instead been used to clarify the newb’s need.
I understand why experts add these asterisks to help sessions: they are useful for some people even if not for this beginner, and experts are interested (even fascinated) by all the intricate details. These discussion areas are not strictly for newb-help. They’re for general discussion among many people. There’s no rule against talking about advanced or rare options.
And it’s hard to know what will be useful, or what the newb really means, or what will resonate with them to help them find a solution. It’s all difficult.
But you should at least recognize who you are addressing and whether you are helping them. If you want to help the beginner, try to resist the impulse to add little-traveled tangents. Focus on the question at hand and try hard to understand the newb’s situation and mindset. Speak their language so they can hear you.


The US Department of Transportation finalized its plans today to weaken fuel efficiency standards, calling it "among the largest deregulatory actions under the second Trump Administration."
It's a nail in the coffin for Biden-era standards that would have required fleet average fuel economy to reach 50.4 miles per gallon by model year 2031. President Donald Trump's plan requires 34.9 miles per gallon, not much higher than the 30.1-mile-per-gallon target previously set for model year 2024.
Consumer advocacy, health, and environmental groups are incensed
The Trump administration claims its plan would shave $1,300 off the average cost of a n …

What could possibly go wrong?
Raleigh, NC


This morning, DDoSecrets published an exciting new dataset: Filesystem images of the partitions from an in-use Flock ALPR camera. 404 Media and Wired published a joint investigation into it. I downloaded the dataset and am now thoroughly nerd-sniped.
Hackers from a collective called stegan0gram collected the data. “Why just destroy [Flock cameras] when we can reverse engineer them and find the secrets of those spying on us?” one of the hackers told 404 Media and Wired in an interview. “We liberated hardware in the field, disarmed them, and proceeded with reverse engineering of the cameras and associated solar equipment.”
Below are a few of the secrets that I've found so far.
I'm crunching data and writing these newsletters in my free time. If you want to support my work, consider becoming a paid supporter.
This camera is running an obsolete, end-of-life version of Android
Flock cameras run on a modified version of Android. The specific build that this Flock camera was running at the point in time the firmware was extracted was from June 5, 2025.
Despite being a relatively recent build, the Flock camera was running Android 8.1. This version of Android was released in 2017, and officially stopped getting support from Google in 2021 (see the Android end-of-life page for more info). And despite Google publishing security fixes for Android 8.1 until 2021, the Android patch level is 2018-06-05. This camera is missing Android security updates for the last eight years.
Android runs on the Linux kernel. This Flock camera was running Linux 3.18.71, released in 2017. The 3.18 series was maintained until May 2019, ending at 3.18.140 — this camera is 69 releases short of even that. This kernel is over nine years out-of-date.
Here are a few publicly-known vulnerabilities that this camera is probably vulnerable to, and that affect components that this camera ships with. I don't actually have this Flock camera to test these on and confirm that the hacks work, but what I do know is that this Flock camera's patch level predates all of these vulns, despite patches being available for many years.
- CVE-2021-1905 Qualcomm Adreno GPU – use-after-free. Any code running on the Flock camera, including in unprivileged apps, can corrupt kernel memory through the GPU driver and take full control of the device. Patched in May 2021.
- CVE-2018-9568 ("WrongZone") – kernel socket type confusion. A program running on the camera can confuse the kernel's socket handling over IPv6 and escalate itself to root. Patched in December 2018. (Here's public exploit code for this one.)
In a statement to 404 Media and Wired, a Flock spokesperson said:
Flock takes security seriously and maintains a public Vulnerability Disclosure Policy for security researchers to report potential vulnerabilities directly to us. We received no report through that process, and based on the limited information provided, we do not have enough detail to assess the claims being made. If the individuals identified legitimate vulnerabilities, we encourage them to submit their technical findings through our vulnerability reporting process so our security team can review them and take any appropriate action.
lol.
Where I found this in the data
If you want to follow along, DDoSecrets published this dataset here.
The Android version and patch level are listed in multiple places, but the easiest place to find it is in the system partition. If you download partitions/24_system.img (1.5 GB) and extract it, you'll find a file, build.prop, which includes these lines:
ro.build.version.sdk=27
ro.build.version.release=8.1.0
ro.build.version.security_patch=2018-06-05
ro.build.date=Thu Jun  5 20:05:57 UTC 2025
The Linux version can be found in the boot partition. If you download partitions/21_boot.img (32 MB) and extract it, you'll find the kernel image in a file called kernel. You can find the Linux version with:
❯ tail -c +16496 kernel | zcat 2>/dev/null | grep -am1 'Linux version'
Linux version 3.18.71-perf-gaf770dc (android@e593ce924ef6) (gcc version 4.8 (GCC) ) #1 SMP PREEMPT Thu Jun 5 20:15:45 UTC 2025
Credentials into Flock's live production infrastructure
Before I go into detail here, I want to emphasize something real quick:
It's illegal to connect to Flock's servers using leaked credentials without their permission.
The Android firmware for this Flock camera includes 20 separate Flock apps, 19 of which all share a library called com.flocksafety.android.common.lib. If you decompile the library, there's an interesting method in the CameraSettings class:
public final String getHpnotiqApiKey() {
    return "HaJ3FgupAm8RrDJW3MHgT9X7Ft27eVaD";
}
This is an API key, hard-coded straight into the app. Flock runs a backend service at hpnotiq.flocksafety.com. When the camera needs new credentials, it makes an API request to hpnotiq that looks like this:
POST https://hpnotiq.flocksafety.com/api/v3/devices/credentials
x-api-key: HaJ3FgupAm8RrDJW3MHgT9X7Ft27eVaD

macAddress=F46ADD5746FB
Note that this specific Flock camera's MAC address is F4:6A:DD:57:46:FB.
Presumably, you can use this hard-coded API key to obtain credentials for any Flock camera, based on its MAC address.
The API appears to respond with an Auth0 client ID and secret. Auth0 is an identity management company owned by Okta. The camera then stores those credentials in plaintext.
Btw, those credentials, which might actually still be live and active (I'm honestly not sure because I didn't try them), are:
{
    "clientId":"CPkOAuOKFwNhPavKO01Htxbn6yIwASro",
    "clientSecret":"ZRExGjbVjBB1wx04RmsMeWKbpMO5zQxLKNZg25D-1LUKbfQbmByajx-8lyB6LwSV"
}
These credentials can then be used to mint bearer tokens by sending them to https://device-login.flocksafety.com/oauth/token, and getting back a short-lived FlockAuth0Token which can be used to interact with Flock's backend servers, authenticated as this camera.
Where I found this in the data
The API key is in the system partition. Download partitions/24_system.img (1.5 GB), extract it, and you'll find 19 Flock apps under app/: flock-sambuca, flock-collins, flock-phone-home, etc., each containing an APK. Decompile any one of them and look for CameraSettings in com.flocksafety.android.common.lib. The shared library is bundled into all 19 apps, so the key is in every one of them.
flock-sambuca is the app that uses it for provisioning credentials. Its Auth0ServiceManager class builds the credentials request, and the URLs for both hpnotiq.flocksafety.com and device-login.flocksafety.com are in that APK's string resources (resources/res/values/strings.xml).
The Auth0 client ID and secret are on a different partition. Download partitions/27_persist.img (32 MB) and extract it. The file is at flock/auth0/auth0_cred. This is the camera's /persist partition, which is not encrypted and is designed to survive a factory reset.
The MAC address and the 2,264 calls to hpnotiq come from the camera's logs, in partitions/53_media.img (18 GB). Those sit inside an encrypted container, though the key to it is stored on the same partition in a file called expand_1fcdafef903c40cab3aff81bec914d01.key, lol. Once it's unlocked, the logs are gzipped tarballs under media/0/media/crashpack/.
This specific camera was in a suburb of Milwaukee
The Flock camera's logs include camera location GPS coordinates 155 times, all within about 100 meters of each other, which I think is ordinary GPS jitter for a receiver that never moves. The coordinates that appear most often are 43.10151313, -88.05270186. If you search for that in Google Maps, you'll end up in a suburb just northwest of Milwaukee.
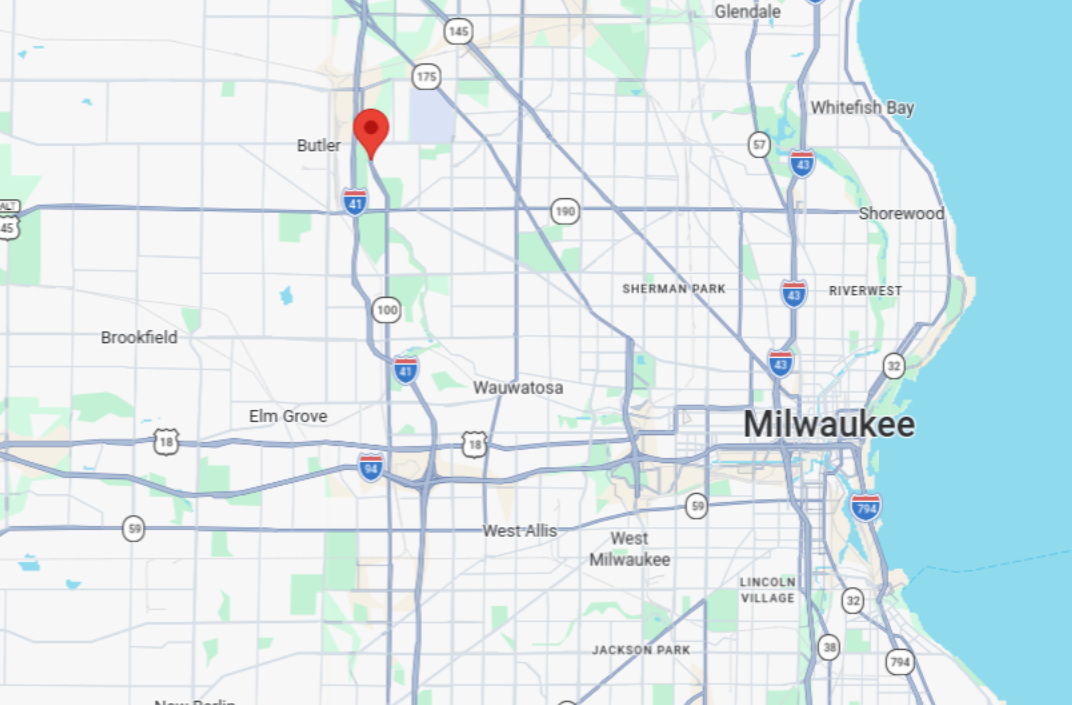
I've never been to the Milwaukee area, but it looks like this Flock camera is in a city called Wauwatosa, on N Mayfair Rd, just off of Webster Park.
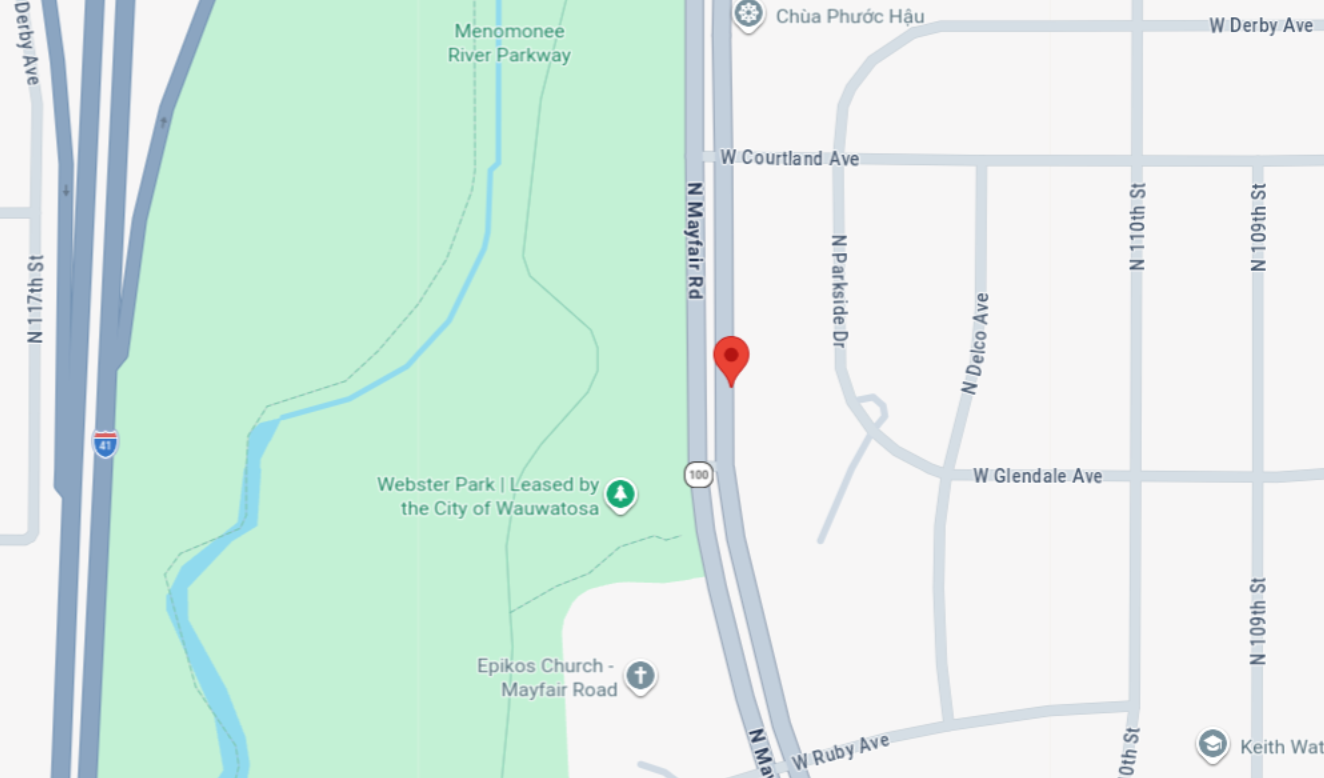
Using Google Street View, I walked around N Mayfair Rd looking for a Flock camera. It looks like the GPS is slightly off, and it's actually on the west side of the street, near a parking lot for the park.
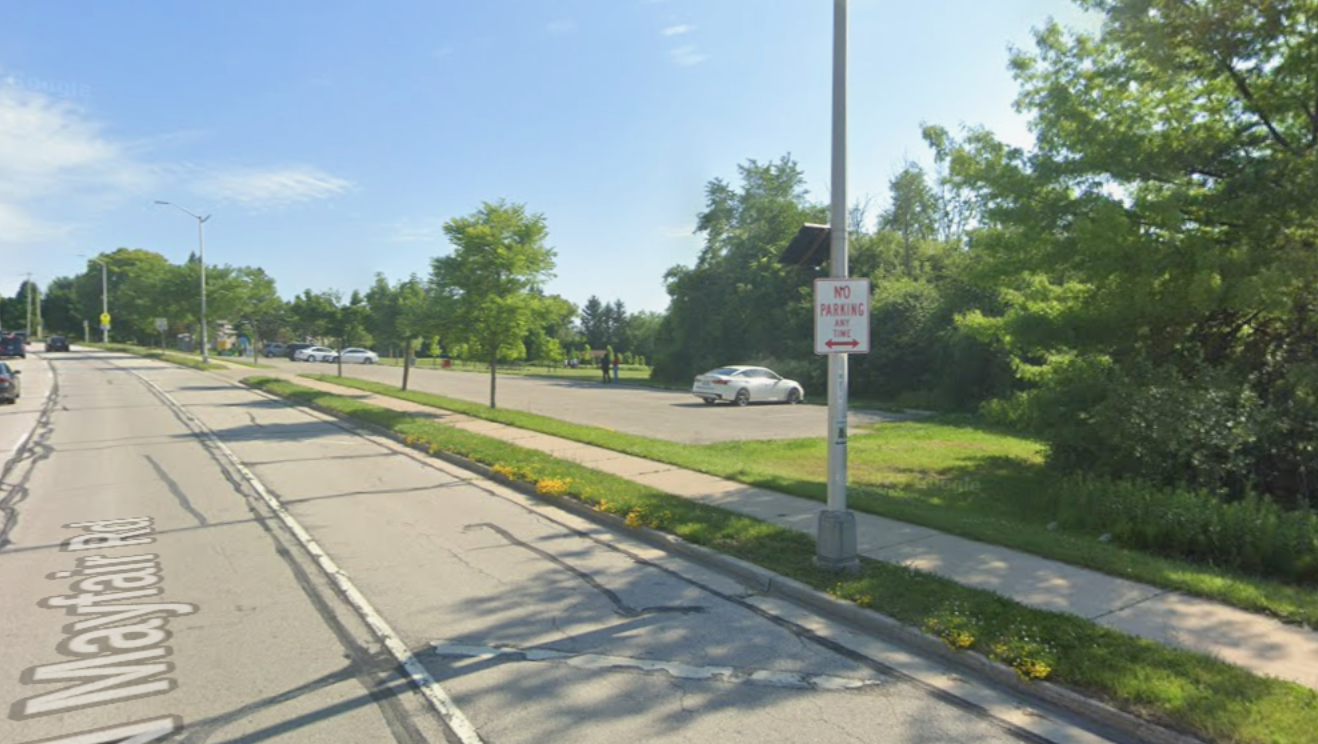
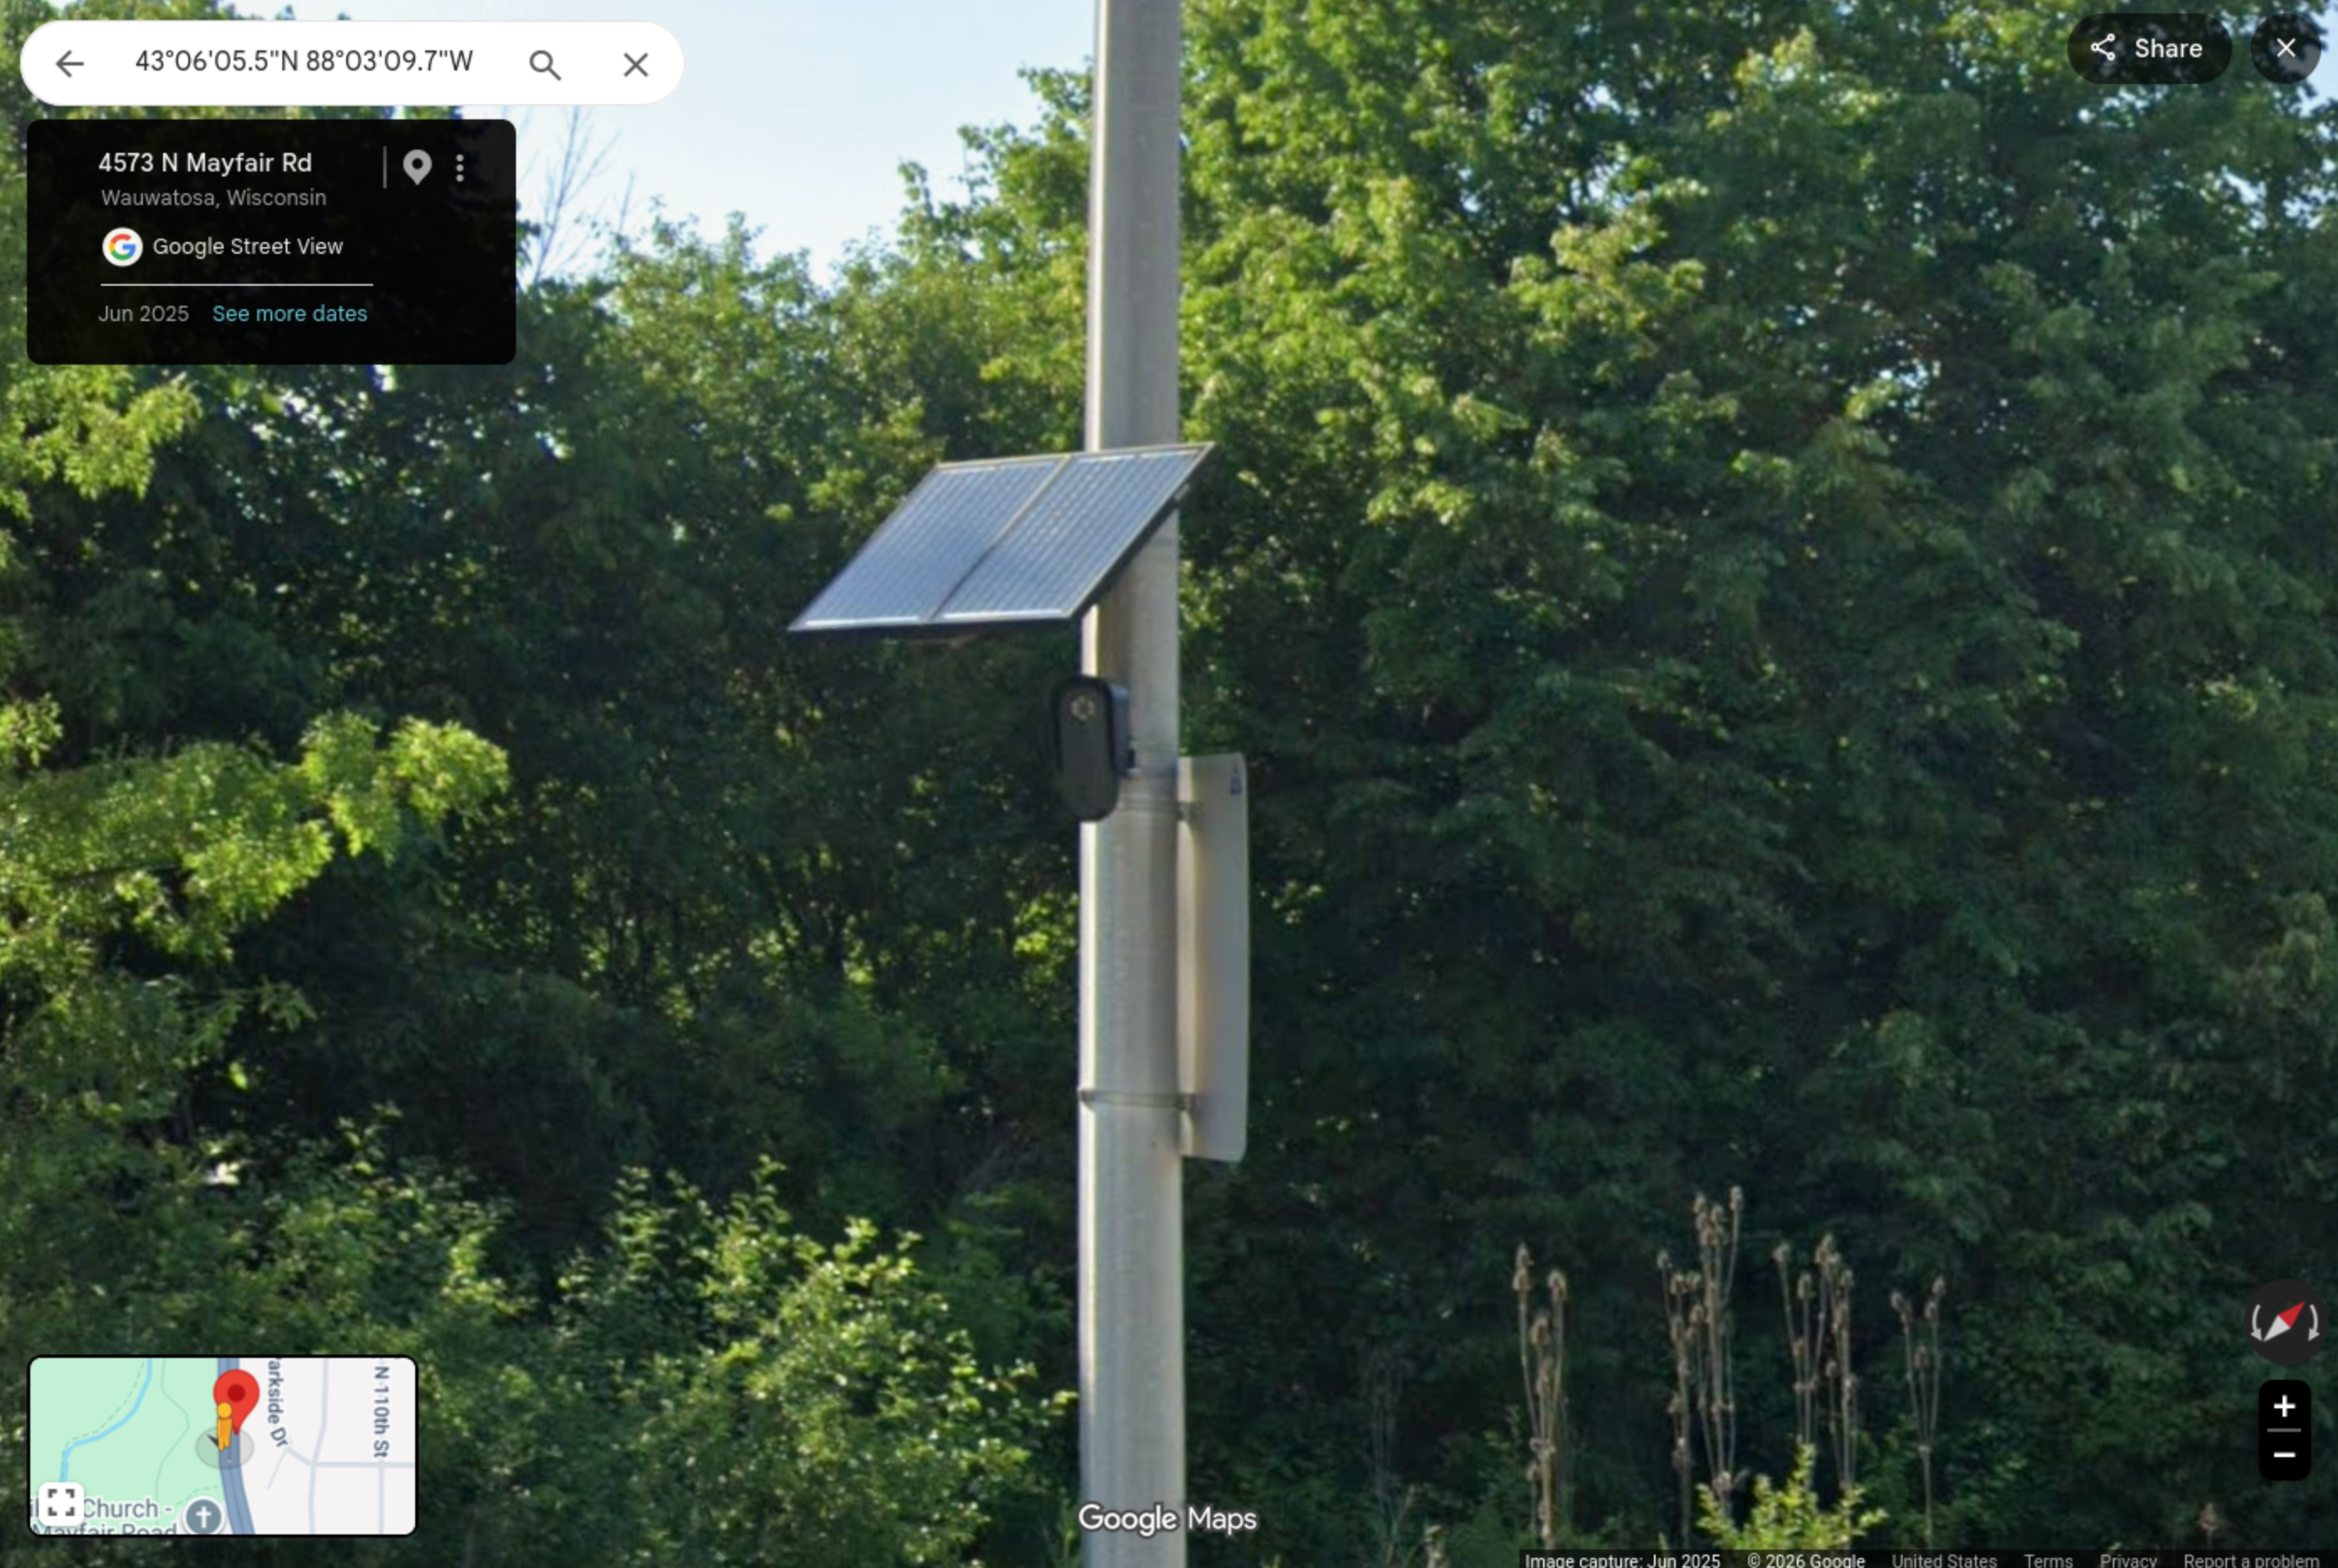
There you are, Flock camera serial number 23091220026 with MAC address F4:6A:DD:57:46:FB!
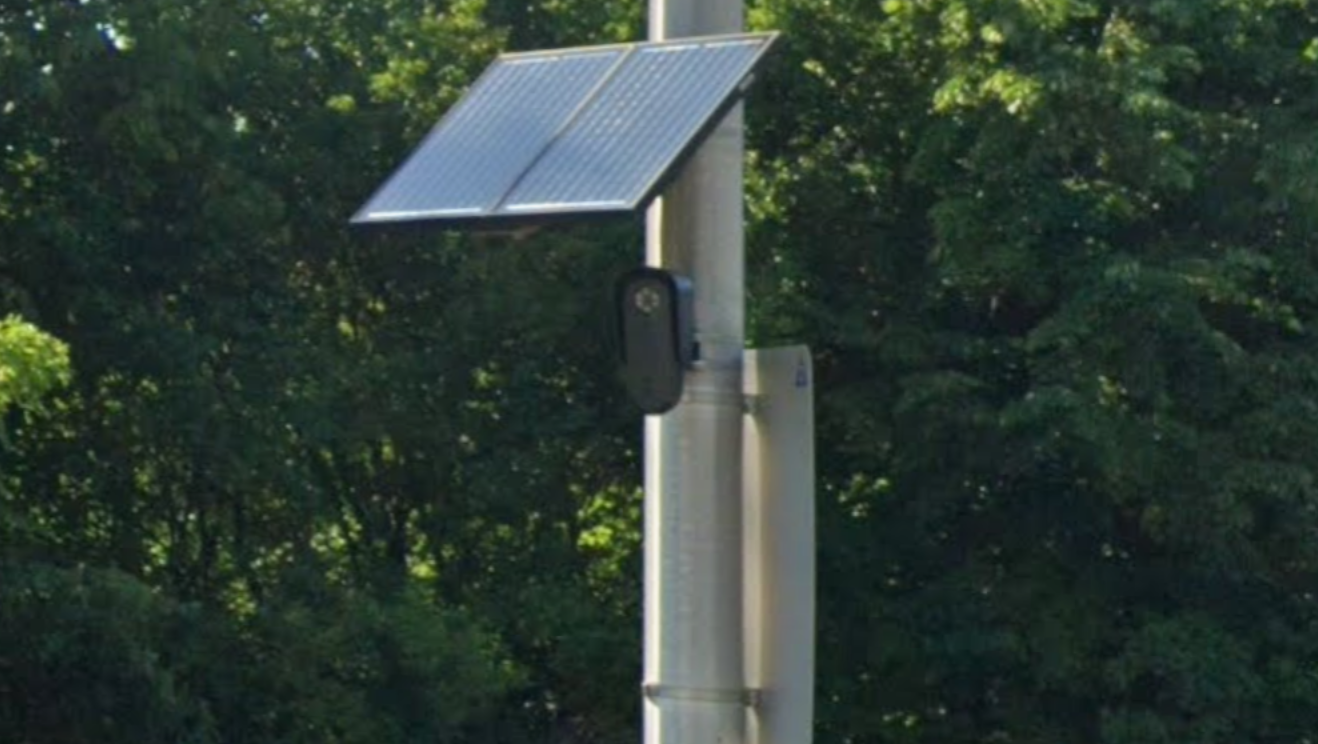
Who could have realized that this little camera, spending all its time spying on the innocent people driving by, would some day find its way into the hands of hackers from the stegan0gram collective?
Where I found this in the data
Download partitions/53_media.img (18 GB), extract it, mount the (barely) encrypted filesystem, and then look at the logs in media/0/media/crashpack/. Extract one of the log files – any of them, it doesn't matter. Inside there, there are many logs with filenames like ciroc.2026-*.log. Grep those for Location and you'll see the GPS coordinates:
❯ cat ciroc.2026-01-27.3.log | grep Location
01-28 08:22:31.304 INFO  [Binder:1584_1] QCamera2: Location: 43.10151313, -88.05270186
01-28 08:32:32.240 INFO  [Binder:1584_3] QCamera2: Location: 43.10151313, -88.05270186
--snip--
With luck, this reporting will encourage city councils everywhere to cancel their contracts with Flock and other ALPR vendors, and to stop giving the police more surveillance tools at the expense of everyone's privacy.


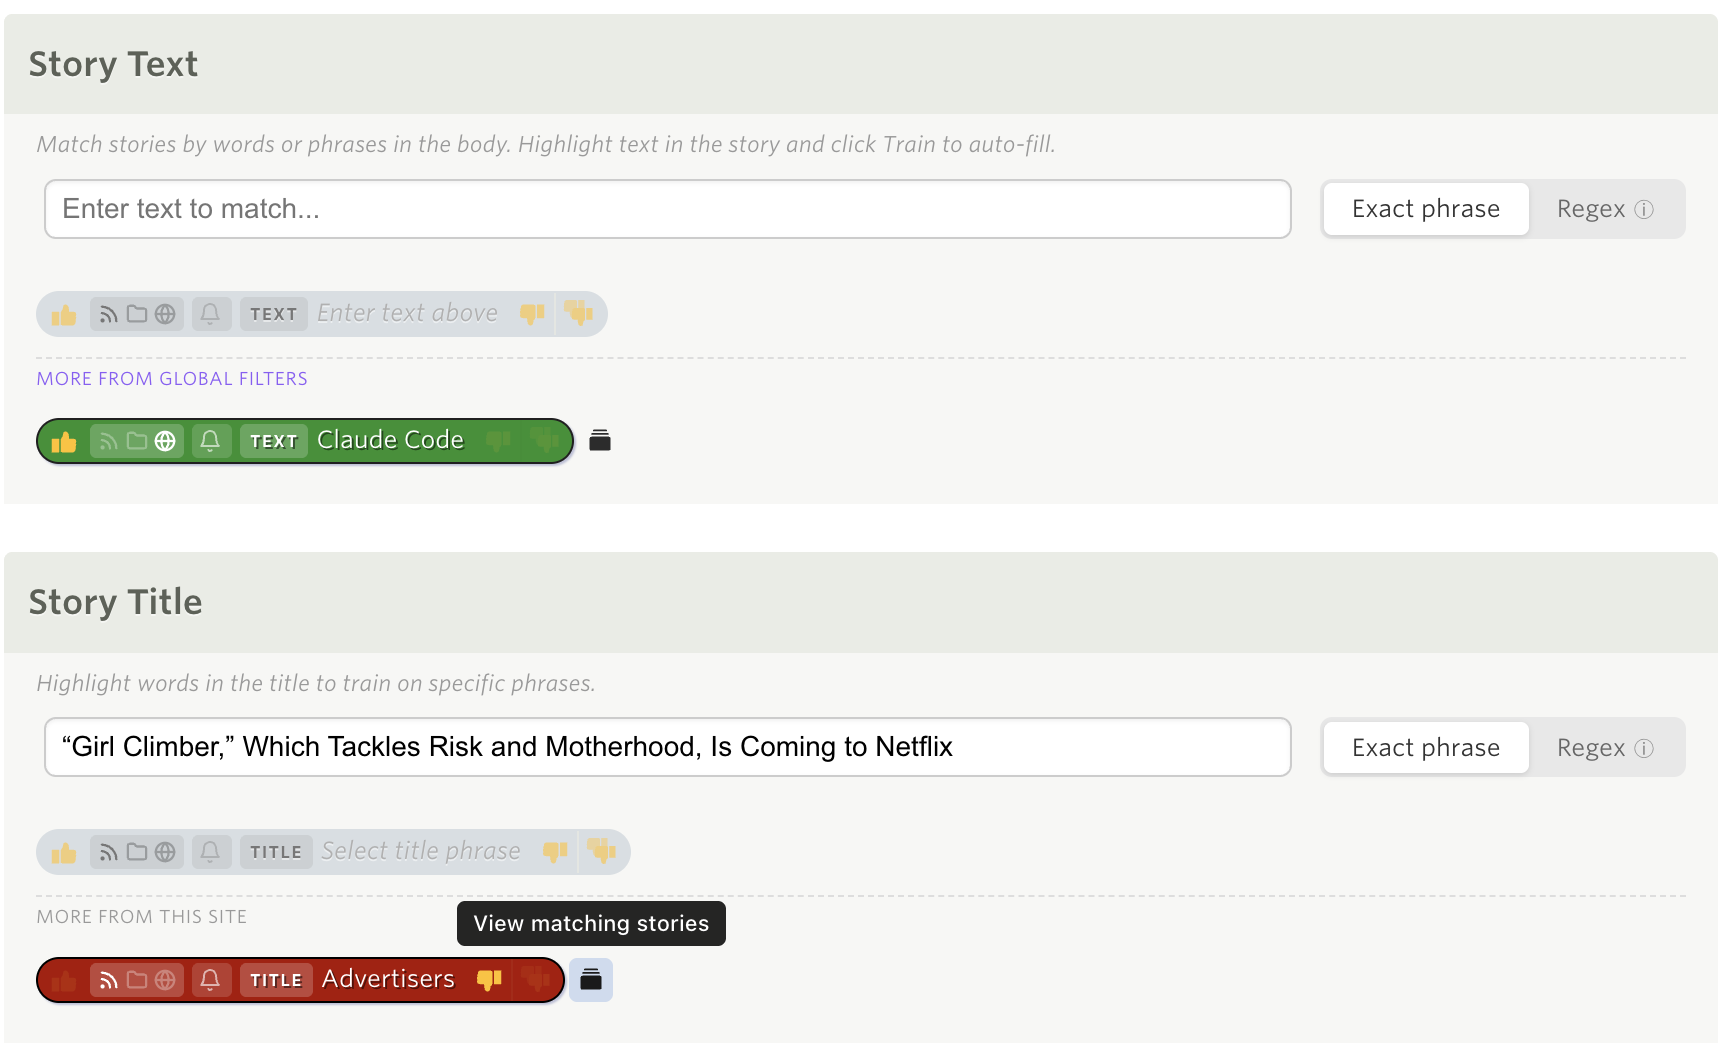
The Intelligence Trainer has always asked you to decide blind. You see a tag or an author on a story and you can train it up or down, but you can’t see what else that decision would touch. Is this author a regular on this site or a one-time guest? Does the “review” tag mean product reviews or book reviews? How many stories does “sponsored” actually hit? Until now the only way to find out was to train it and watch the scores change across the feed.
Now every tag, author, and URL on a story has a small button next to it: View matching stories. Click it and the story list turns into a view of every story on that site that carries that exact value. Not just unread stories, read ones too, so you get the whole picture. It’s the fastest way I’ve found to answer “what else is like this?”
From a story
Open any story and look at the author and tags under the title. Each one now has a small stories icon beside it. Click it and the list filters down to every story that matches that one author or tag. The URL line gets the same button, so you can pull up every story that shares a path segment, which turns out to be a great way to find a series or a podcast on a site that doesn’t tag its posts.
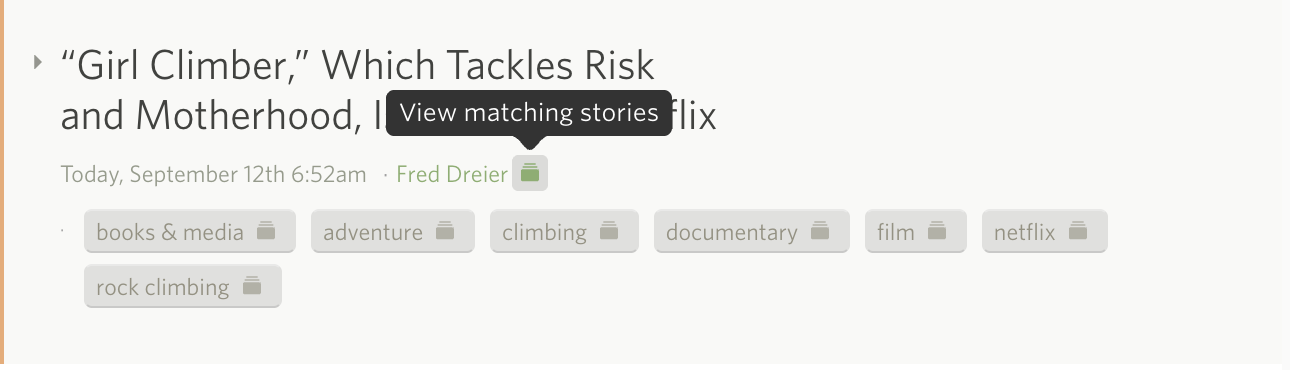
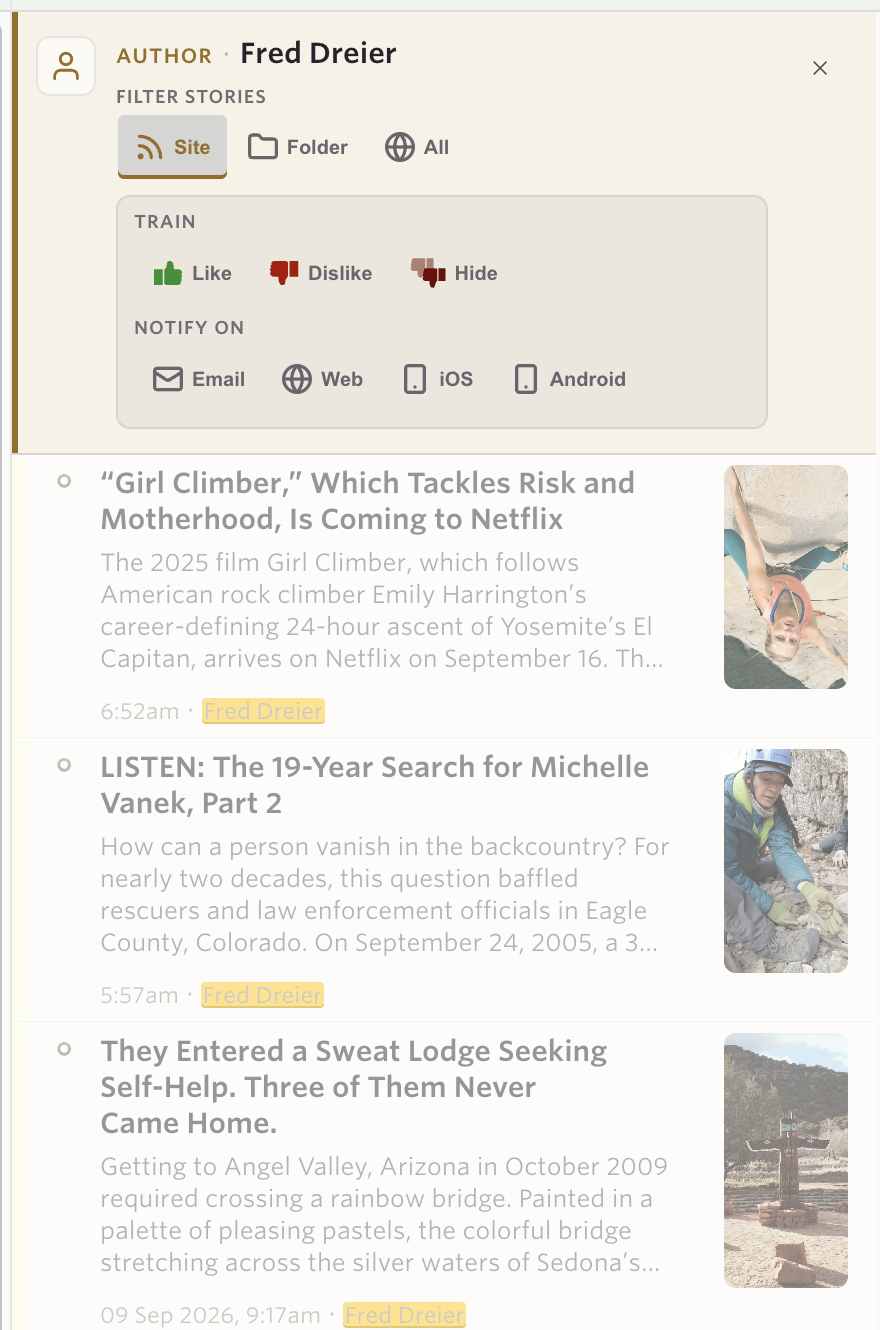
The matching text is highlighted on every row of the filtered list. An author filter marks the author on each story, a title filter marks the words it matched, and a text filter marks the phrase in the preview.
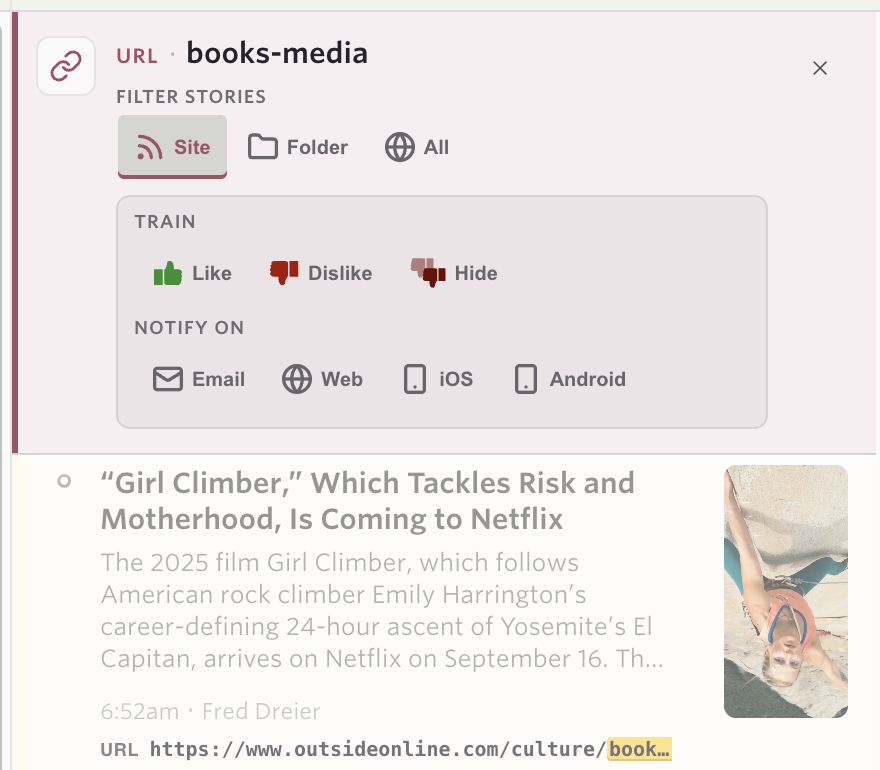
A URL filter is a little different, since the link isn’t normally part of the story list. When one is active, each row grows a URL line with the matched segment highlighted, so you can see exactly why the story is there.
The filter rides along in the URL, so reload, back and forward, and bookmarks all do what you’d expect. I have a few of these bookmarked now for authors I check in on every couple of weeks.
From the trainer
The same button lives in the Intelligence Trainer on every tag, author, title, URL, and text classifier you’ve saved. This is the part I’ve wanted for years. You trained “sponsored” as hidden a long time ago and have a nagging feeling it’s swallowing something it shouldn’t. Click the magnifying glass on that classifier, the trainer closes, and you’re looking at exactly the stories it hides. A Back to trainer link in the banner takes you back to where you were.
Regex classifiers and natural language classifiers don’t get the button, since neither one matches a single exact value.
The banner
At the top of every filtered list is a banner that names the filter and gives you three things to do with it.
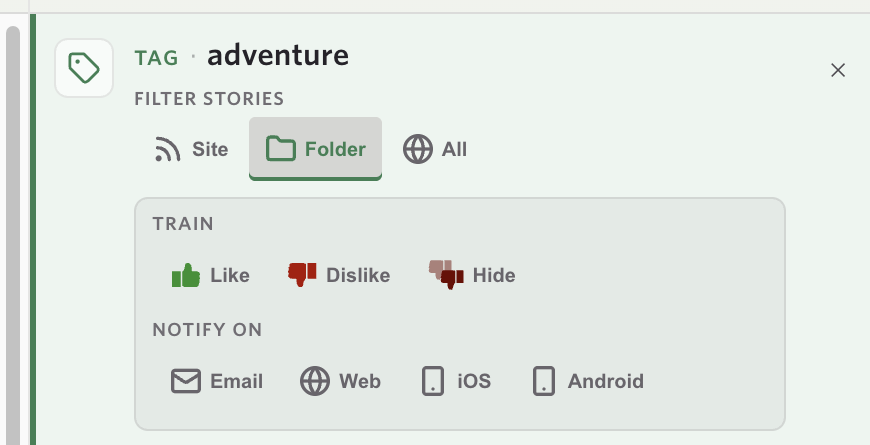
Filter stories widens the list from this site to the whole folder or to all of your sites. Site scope is available to everyone. Folder and All follow the same rule as folder and global classifiers, so they need Premium Archive. On Archive, a folder or all-sites tag filter runs against the story search index rather than a window of recent stories, so a tag that appears on a dozen stories spread across forty sites turns up all twelve.
Train is Like, Dislike, or Hide (the super dislike). It saves the same classifier the trainer would, and the list recomputes in place: the score flips on each row, the unread counts in the sidebar update, and stories you just trained down stay in the list so you can see what you did instead of watching rows vanish out from under you.
Notify on is Email, Web, iOS, and Android. These are the per-classifier notifications from earlier this year, now reachable from the same banner. You find a tag, confirm it matches what you think it matches, and turn on a notification for it without ever opening the trainer.
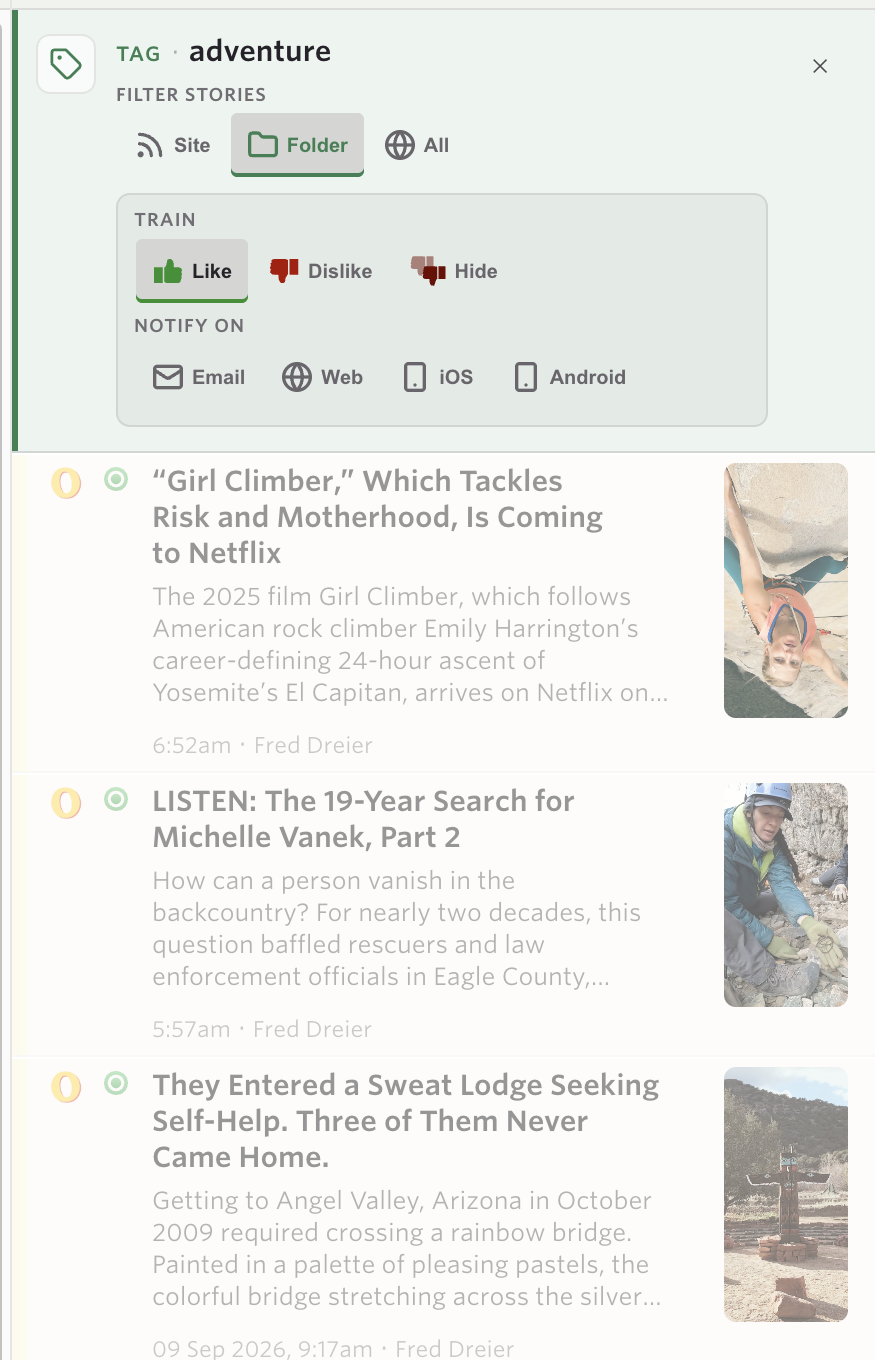
One detail worth knowing: the Filter stories toggle only changes what you’re looking at. Training and notifications still write to the classifier’s own scope. Browsing a tag across a folder doesn’t quietly turn a site classifier into a folder classifier.
A few ways I’ve been using it
- Deciding whether to follow an author. A group blog has a new writer. Click the button beside their name, read three of their stories, then Like them from the banner.
- Auditing a hidden tag. Open the trainer, click the magnifying glass on a red tag, and check that it’s hiding what you meant it to hide.
- Pulling up a series. Click the button on the URL line of a story with
/podcast/in the link and every episode on the site lines up. - Setting up a notification with confidence. Widen a tag to a folder, see that it matches the right kind of story, and turn on the iOS notification right there.
Availability
Matching Stories is available now on the web for everyone. Site scope, training, and highlighting work on every account. Folder and All scopes and the Notify on controls follow the existing rules for Premium Archive and Premium Pro.
If you find a tag or author that should match and doesn’t, or have an idea for where else this button belongs, let me know on the NewsBlur forum.


Next Page of Stories